Risk Tip #3 – Developing a Consequence Matrix
The third in my risk tip series is one that has arisen from my observations of consequence matrices over the last few years. This blog isn’t about how to assess consequence, but more importantly, what to assess it against.
In Risk Tip #1 I addressed the issue of likelihood and how difficult, if not impossible, it is to assess likelihood based on frequency when the overriding consideration as to how likely it is that a risk will occur is the strength of the controls. How can we estimate the likelihood of a risk such as explosion at fuel storage depot using frequency or probability when it is the effectiveness of the controls that is going to determine whether it will occur or not?
In this blog, I focus on the other element of the assessment process – the parameters against which we estimate the consequence of a risk should it materialise.
Consensus
In my courses, I highlight that when it comes to risk assessment (i.e. determining the likelihood and consequence for a risk), the best you can ever hope for is a consensus. What I mean by that is that it is not an exact science – there is no right or wrong answer. We use the judgement and the experience of those conducting the risk assessment to determine likelihood and consequence but, ultimately, it is just that – a judgement
So, what does this mean for us?
It means that is it absolutely critical that when developing our Likelihood and Consequence criteria that there is enough granularity contained within to enable a more considered consensus.
This has led me, once again, to question the current wisdom relating to an aspect of risk management – that being the development of the consequence matrix.
“Standard” Consequence Matrices
Every organisation with a risk management program is likely to have a Likelihood Rating Matrix; a Consequence Rating Matrix and a matrix that is used to determine the level of risk.
I discussed in Risk Tip #1 what I believe to be the shortcomings with the current approach to assessing Likelihood. There are also inadequacies in the current approach to assessing consequence level.
So, let’s start with the purpose of the Consequence Matrix. We identify our risk and the Consequence Matrix provides a comparative tool that allows us to determine the expected consequence level should the risk materialise. We then compare this risk level against a pre-determined criteria to evaluate whether the risk is acceptable at its current level or whether further treatment may be warranted.
Some simplified consequence matrices provide one statement for each consequence level as shown below:
Assessing Consequences
Rating |
Public Safety, Environment, Lifestyle, Economy, Public Administration |
| Insignificant | Minor issue of little concern to community |
| Minor | Isolated case, some small disruptions |
| Moderate | Requires attention, inconvenience |
| Major | Requires urgent attention, impact days |
| Catastrophic | Wide damage, lasting weeks, impact high |
Using such a matrix makes it almost impossible, in my opinion, to get a comprehensive understanding of the full range of impacts should the risk materialise.
In my observation, most organisations recognise that there are multiple consequences for each risk, and utilise a matrix that details the consequences for multiple impact areas – as shown below:
Level |
Consequences |
| 1 | No injuries, damage, environmental or operational impact. |
| 2 |
People – Injury/ies requiring first aid, no disability, no lost employee time; Public perception – Interest mitigated; Environment – Contained impact Operations – Minor damage, potential slowdown of operations. |
| 3 |
People – Injury/ies resulting in work stoppage, no disability; Public perception – Interest raised, no marked concern, public image untarnished; Environment – Uncontained but repairable impact on site; Operations – Minor damage to infrastructure, resulting in an organisational slowdown / minor idle time. |
| 4 |
People – Disability/ies/severe injury/ies Public perception – Marked and sustained interest, concern expressed; Environment – Uncontained but repairable impact off site; Operations – Significant damage to infrastructure, major minor idle time/ slowdown. |
| 5 |
People – Severe injuries, loss of lifePublic perception – Medium-term sense of insecurity Environment – Significant and non-repairable impact; Operations – Loss of a critical infrastructure component or stoppage of operations. |
Or the more common form:
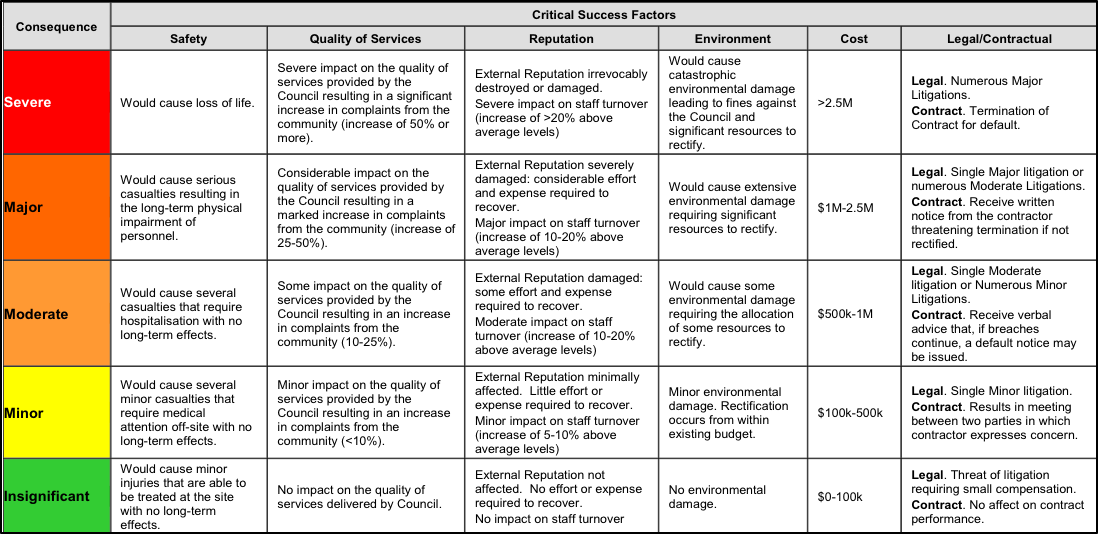
The difficulty with Consequence Matrices such as these lies in the interpretation of what is, primarily, descriptive guidance.
The matrix uses terms such as:
- numerous;
- catastrophic; major;
- irrevocably;
- considerable etc.
This then begs the question (using Legal/Contractual as an example):
- What does numerous mean?
- What is a major litigation?
- What do we define as a litigation?
If we go back to our discussion in relation to the consensus, we can see that it would be difficult to gain a consensus with such subjective/descriptive categorisation of consequence.
So, is there a more effective way to develop a Consequence Matrix? The answer is yes – and it involves the linking of the Consequence Matrix to the organisation’s performance measures.
The new Paradigm in Consequence Matrices
For me it is simple: we use performance measures to monitor achievement against our objectives. Wouldn’t it also be wise to use the same performance measures to detail the varying levels of impact should a risk eventuate.
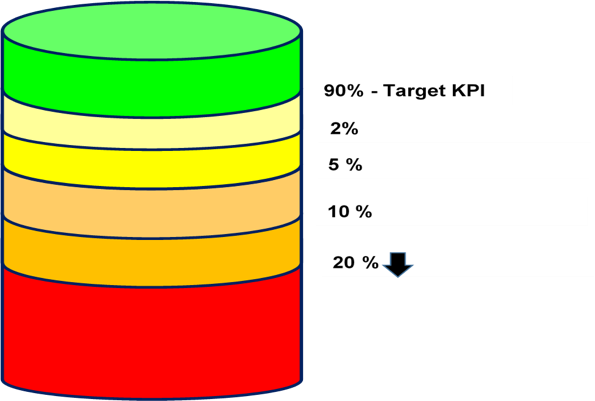
Let’s say we use customer satisfaction as a performance measure for Reputation with our target level (Key Performance Indicator) being above 90%. We may then determine the impacts to the organisation of the varying degrees of reduction in customer satisfaction as shown below:
- Any drop by less than 2% for one survey period is seen as within the margin of error.
- Any drop of between 2-5% for one survey period is minor but is not going to materially impact on the business.
- Any drop of 5-10% for one survey period or 2-5% for two or more survey periods may indicate ongoing issues.
- Any drop of 10-20% for one survey period or 5-10% for two or more survey periods is of significant concern and requires immediate attention.
- Any drop of greater than 20% for one survey period or 10-20% for two or more survey periods may threaten the ongoing viability of the organisation.
I term this: the Continuum of Performance which is highlighted in the diagram below:
We can then take this knowledge to start to develop our Consequence Matrix.
Reputation |
|
| Severe |
If this risk was to materialise it could result in: Customer satisfaction falling by greater than 20% for one survey period or 10-20% for two or more survey periods |
| Major |
If this risk was to materialise it could result in: Customer satisfaction falling by between 10-20% for one survey period or by 5-10% for two or more survey periods |
| Moderate | If this risk was to materialise it could result in: Customer satisfaction falling by between 5-10% for one survey period or by 2-5% for two or more survey periods |
| Minor |
If this risk was to materialise it could result in: Customer satisfaction falling by between 2-5% for one survey period |
| Insignificant |
If this risk was to materialise it could result in: Customer satisfaction falling by less than 2% for one survey period |
Of course, we do not measure our reputation based on one performance measure so we build the Consequence Matrix further using additional performance measures (in this case: staff turnover and negative press) and using and/or statements:
Reputation |
|
| Severe | If this risk was to materialise it could result in:
|
| Major | If this risk was to materialise it could result in:
|
| Moderate | If this risk was to materialise it could result in:
|
| Minor | If this risk was to materialise it could result in:
|
| Insignificant | If this risk was to materialise it could result in:
|
So, to summarise, the steps in this process are as follows:
- Step 1 – identify the categories that you are going to measure consequence against (reputation; financial; safety; compliance; quality of service .etc.).
- Step 2 – identify between 2-5 performance measures for each of these categories that are key determinants of achievement of objective (Key Risk Indicators).
- Step 3 – Determine the Continuum of Performance for each of the performance measures.
- Step 4 – build the Consequence Matrix for all of the consequence categories.
Conclusion
Linking the Consequence Matrix to performance measures enables us to consider the true impact of a risk to our objectives should it materialise. The added advantage of adopting this approach is that a consensus is more easily achieved and it will result in better decisions.
Combining this with the revised Likelihood Rating Table in Risk Tip #1 will significantly improve risk assessments within any organisation.
If you want to learn more about developing the Consequence Matrix then check out the Paladin Risk Management Service’s face to face courses or consider developing your risk management skills from home and do the online course.